

Key Takeaways
- Calibration is not verification. Calibration quantifies error and drift over time; verification is a simple pass/fail check. Your program needs the former to be audit-ready.
- Use the five-point up-down method. Test at 0%, 25%, 50%, 75%, and 100% of span on both ascending and descending runs to check for linearity and hysteresis errors.
- Always record as-found data first. Documenting the gauge's condition before any adjustment is critical for reverse traceability and is a non-negotiable for ISO/IEC 17025 compliance.
- Optimize intervals with drift data. Instead of defaulting to annual calibration, track as-found data over several cycles to determine the actual end-of-period reliability (EOPR) and set data-driven intervals.
A process engineer discovers a pressure gauge on a critical heat-treat furnace has been reading 3 psi low for an unknown period. The gauge passed its last calibration 11 months ago. The immediate question isn't just whether the gauge needs adjustment it's how many production batches ran under incorrect pressure conditions, whether any product must be quarantined, and how far back the out-of-tolerance investigation must go.
This scenario highlights the real stakes of metrology. Effective pressure gauge calibration is not a routine maintenance task; it's a fundamental risk-control function that determines how much confidence you can place in every measurement taken between calibration events. Audit findings tied to calibration documentation are among the most disruptive because they rarely stay contained to a single instrument; assessors trace the procedural gap back to the calibration program itself, which can put dozens or hundreds of certificates under scrutiny. Organizations that work with an ISO/IEC 17025-accredited calibration provider like CTPM gain access to protocols and uncertainty data rigorous enough to make every measurement decision defensible.
This guide details the complete pressure gauge calibration procedure, from reference standard selection to documentation. We will cover the five-point method, error analysis, and using drift analysis to optimize calibration intervals.
What Pressure Gauge Calibration Actually Determines
Calibration is not the act of confirming a gauge reads correctly. It is the process of quantifying how much a gauge's reading deviates from a traceable reference standard and documenting that deviation with a calculated measurement uncertainty. This distinction is critical, as many facilities and even some service providers conflate calibration with verification.
- Verification answers a binary question: Does the gauge read within its specified tolerance? (Pass/Fail)
- Calibration answers a quantitative question: What is the actual error at each test point, and is that error stable over time?
A quality manager reviewing a calibration certificate should be able to see the as-found errors at each test point, compare them to the previous calibration's as-left data, and determine whether the gauge is drifting. If the certificate only states "Pass," you have a compliance document not measurement intelligence. You have no data to assess drift, optimize intervals, or predict future performance.
This is why ISO/IEC 17025:2017 and standards like ASME B40.100 for gauge accuracy classes demand more than a simple check. They require a documented, traceable comparison that generates usable data and supports better calibration decisions over time.
Read more: The Complete Guide to ISO/IEC 17025 Conformity Readiness | CTPM
Step-by-Step Pressure Gauge Calibration Procedure
A defensible pressure gauge calibration procedure produces traceable results that can withstand an ISO 17025 audit or a customer's reverse-traceability investigation. The process can be broken down into two distinct phases: the measurement sequence and the documentation sequence.
The Five-Point Ascending and Descending Method
The standard method for a full pressure gauge calibration involves a five-point, up-and-down sequence. This approach is designed to test the unit under test (UUT) across its full range and identify common mechanical errors. For a 0-100 psi Bourdon tube gauge, the procedure looks like this:
- Preparation and Pre-Check: Before starting, ensure the pressure system is free of leaks. Connect the UUT and the reference standard to the pressure source, then pressurize the system to about 10% of the gauge's range and isolate it. A stable reading confirms the system is sealed; a dropping reading indicates a leak that must be fixed before proceeding.
- Exercise the Gauge: Pressurize the gauge to its full-scale value and hold for one minute, then vent to zero. Repeat this three times. This pre-exercise cycle stabilizes the Bourdon tube's mechanical linkage and elastic properties, minimizing transient errors that can mimic hysteresis. After the final cycle, verify the pointer returns to zero and adjust the zero offset if necessary.
- Ascending Run: Apply pressure to take readings at five cardinal points: 0%, 25%, 50%, 75%, and 100% of the gauge's span. At each test point, allow the pressure to stabilize before recording the reading from the UUT. For analog gauges, gently tap the case to settle the pointer mechanism and eliminate any minor friction before taking the reading. These five points are chosen specifically to reveal linearity errors across the full range, not just at the endpoints.
- Descending Run: From the 100% point, slowly decrease the pressure to take readings at the same five points in reverse order: 75%, 50%, 25%, and 0%. This descending run is not simply a repeat of the ascending run; it is a specific check for hysteresis, which is the difference in output at the same pressure point when approached from opposite directions.
- Final Zero Check: After the final descending reading at 0%, verify that the gauge has returned to its zero point. Any deviation is recorded as the final zero offset.
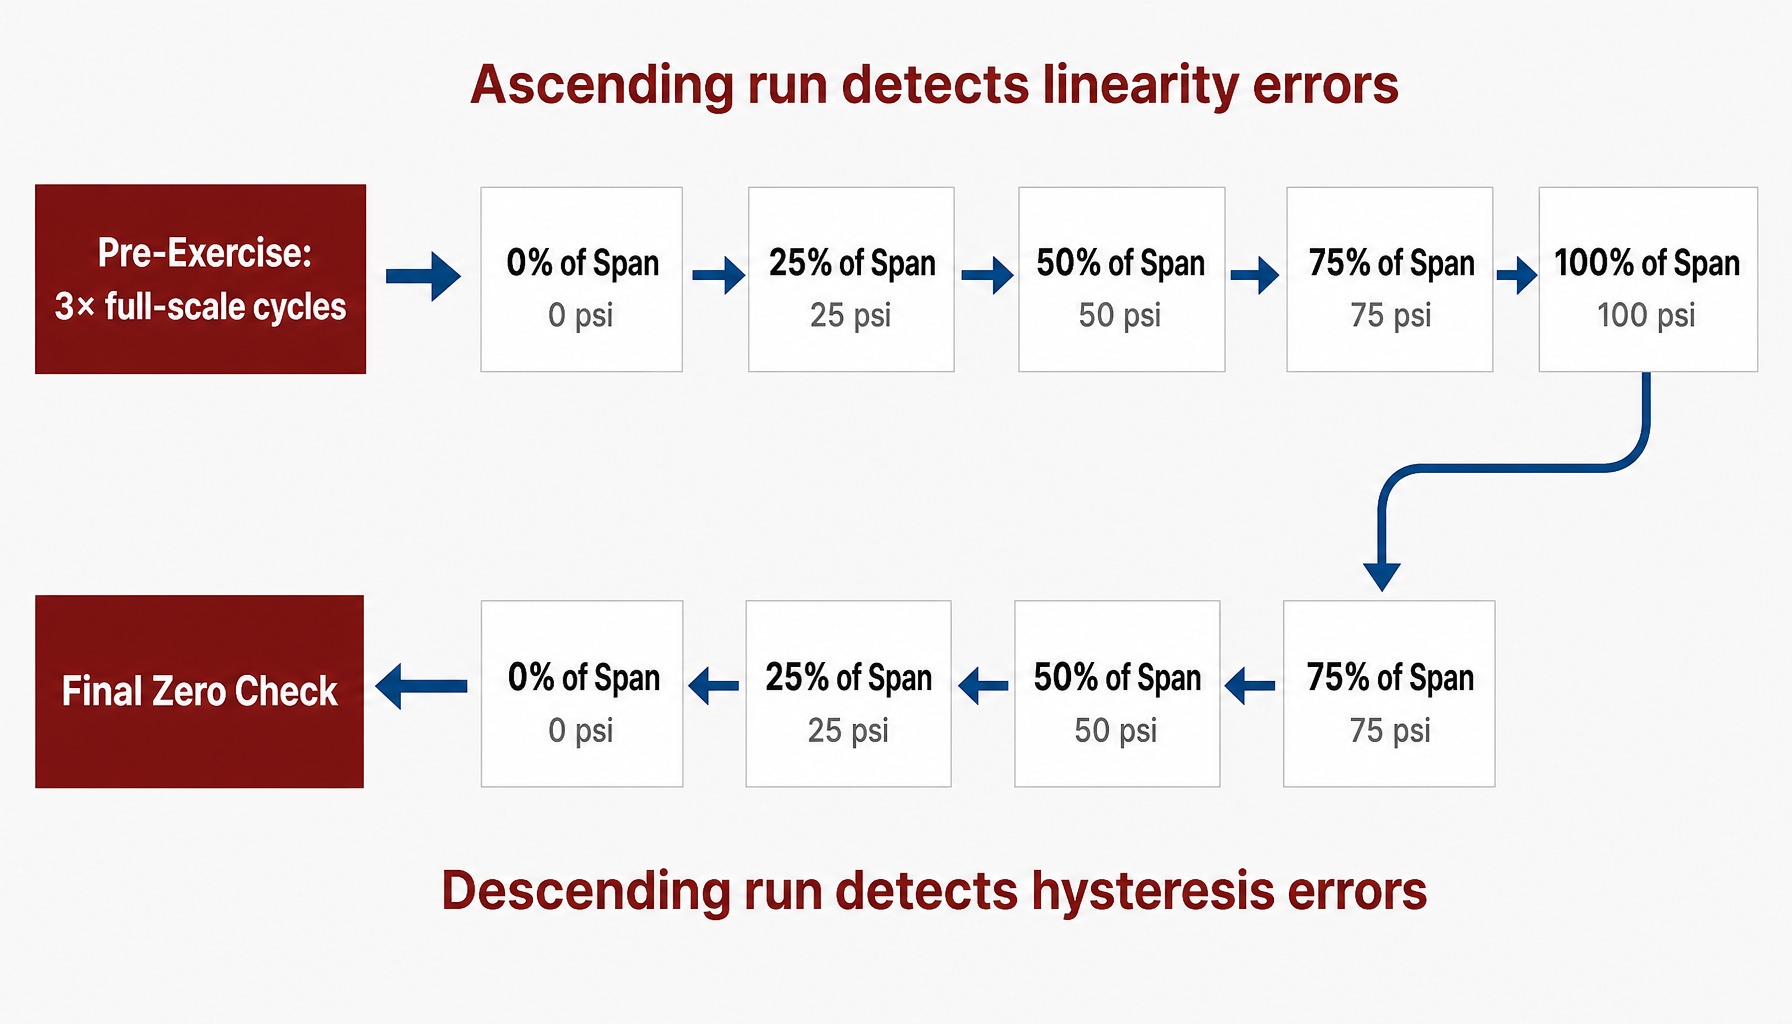
The five-point up-down method reveals both linearity and hysteresis errors.
Recording As-Found and As-Left Data
The documentation sequence is where most calibration programs either build or lose their audit defensibility. The core principle is the strict separation of as-found and as-left data.
- As-Found Data: These are the readings taken during the initial five-point procedure before any adjustments are made to the gauge. This data represents the gauge's true condition as it was being used in your process. It is the only data that matters for reverse traceability if an out-of-tolerance (OOT) condition is found.
- As-Left Data: If the as-found data reveals an OOT condition or a deviation that requires correction, the technician will perform an adjustment (e.g., correcting a span error). After the adjustment, the entire five-point calibration procedure is repeated, and these new readings are recorded as the as-left data.
The critical failure point for many internal calibration programs occurs when a technician adjusts a gauge before recording the as-found data. This action permanently destroys the evidence of the gauge's condition, making it impossible to assess the impact of the deviation on any measurements taken since the last calibration. During an audit, if an assessor asks to see the OOT investigation for a specific gauge and the certificate only shows pristine as-left data, you cannot prove you evaluated the risk a clear nonconformance.
Per ISO/IEC 17025:2017, a compliant calibration certificate must include:
- Unique identification of the instrument calibrated
- Identification and traceability of the reference standard used
- Environmental conditions during calibration (temperature, humidity)
- The test points used (e.g., 0, 25, 50, 75, 100 psi)
- As-found readings and calculated error
- As-left readings and calculated error (if adjusted)
- The calculated measurement uncertainty
- The date of calibration and the identity of the technician
How to Select and Qualify Your Reference Standard
The reference standard is the single largest contributor to calibration quality. Selecting an inadequate reference invalidates the entire procedure, no matter how carefully the technician executes the steps. The primary requirement is that the reference standard has a sufficiently low measurement uncertainty relative to the tolerance of the UUT.
This relationship is quantified by the test uncertainty ratio (TUR) . The traditional rule of thumb is a 4:1 TUR, meaning the reference standard should be at least four times more accurate than the gauge being tested. However, the test-uncertainty ratio is not the same as a simple accuracy ratio; a proper TUR calculation must use the reference standard's expanded measurement uncertainty (from its own calibration certificate), not just its published accuracy specification. Many programs conflate the two, overstating their actual measurement capability.
For example, calibrating a 0.25% accuracy industrial gauge with a 0.1% reference standard seems to provide a 2.5:1 ratio. But if the reference standard's own calibration certificate lists an expanded uncertainty equivalent to 0.12%, the actual TUR is closer to 2:1, which may not be sufficient to make a confident pass/fail statement.
Your primary options for reference standards are:
- Deadweight Testers (DWT): A DWT uses precision-machined piston-cylinder assemblies and calibrated masses to generate a highly accurate and stable pressure. With accuracies often in the range of 0.015% to 0.025% of reading, a DWT remains the primary standard for high-level pressure calibration. However, they require skilled operation and environmental corrections for local gravity, temperature, and air buoyancy.
- Digital Reference Gauges: High-accuracy digital reference standards from manufacturers like Fluke Calibration, Additel, or Crystal offer accuracies from 0.02% to 0.05% of full scale. They are portable, require less training, and offer faster setup, making them a practical choice for most industrial and field calibration work.
Finally, you must select the appropriate pressure medium. For low-pressure pneumatic calibrations, clean dry air or nitrogen is standard. For high-pressure hydraulic work, specific calibration fluids (oils) are used. The choice affects safety, stability, and the overall uncertainty budget, as gas is compressible and requires different handling than hydraulic fluid.
Building a Practical Measurement Uncertainty Budget
Measurement uncertainty is not an academic exercise; it's the number that quantifies the "doubt" in your calibration result and determines whether a pass/fail decision is trustworthy. An accredited calibration certificate must state the expanded measurement uncertainty, but many practitioners cannot interpret what the number means or how it was derived.
An uncertainty budget is a systematic accounting of all potential error sources in the calibration process. For a typical pressure gauge calibration using a digital reference, the major contributors include:
- Reference Standard Uncertainty (Type B): The uncertainty of your reference standard, taken directly from its calibration certificate.
- UUT Resolution (Type B): The smallest readable increment on the gauge being calibrated. For an analog gauge, this is typically estimated as half the smallest division. For a digital gauge, it's half the value of the least significant digit.
- Repeatability (Type A): The random variation observed when taking multiple readings at the same pressure point. This is determined experimentally.
- Environmental Effects (Type B): The potential error from temperature deviating from the 20°C standard, which affects both the gauge and the pressure medium.
Consider a simplified example for illustration: calibrating a 0-200 psi gauge. The reference has an uncertainty of ±0.02 psi, the UUT resolution contributes ±0.05 psi, and repeatability testing shows a standard deviation of 0.03 psi. These individual uncertainty components are combined using a root-sum-square (RSS) method:
- Combined Standard Uncertainty (u_c) = √( (0.02)² + (0.05)² + (0.03)² ) = √0.0038 = 0.062 psi
This combined uncertainty is then multiplied by a coverage factor (k), typically k=2, to produce the expanded uncertainty at a 95% confidence level.
- Expanded Uncertainty (U) = 0.062 psi * 2 = 0.124 psi
This simplified example is intended for illustration only. A robust uncertainty analysis may include many additional contributors depending on the method, reference standard, range, environment, and measurement setup.
This is the value that should appear on the calibration certificate. It means that while the measured error might be a single value, you can be 95% confident that the true error lies within ±0.124 psi of that value.
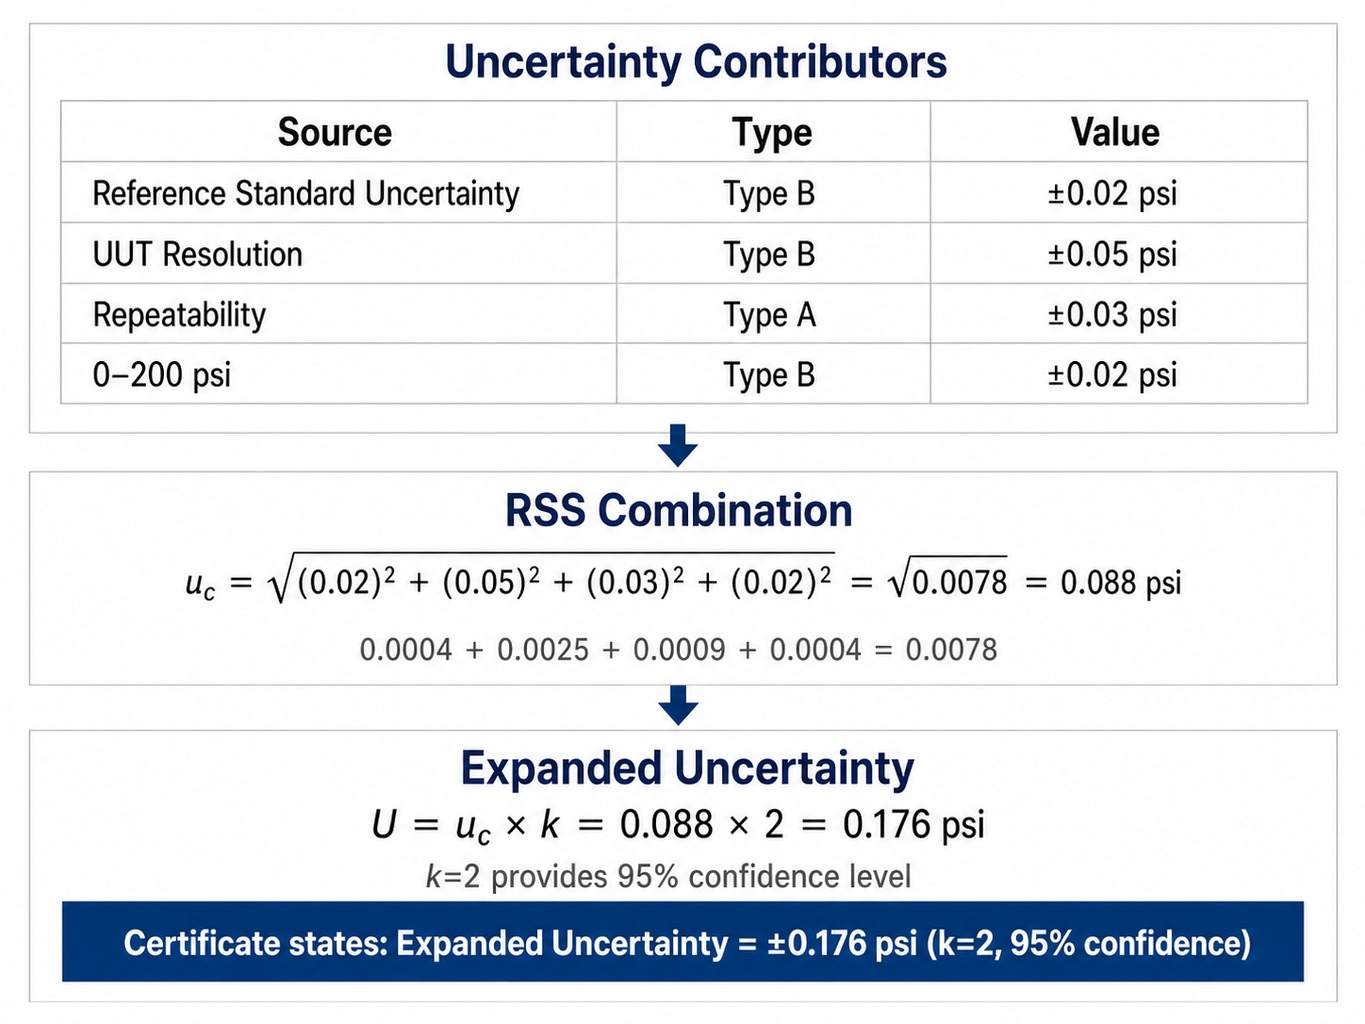
A complete uncertainty budget turns calibration results into defensible data.
Interpreting Hysteresis, Linearity, and Repeatability Errors
A detailed calibration report reveals more than just pass/fail. The pattern of errors across the five-point check can diagnose specific failure modes in the gauge's mechanical health. Confusing these error types leads to incorrect corrective actions.
- Hysteresis Error: This is the difference between the ascending and descending readings at the same pressure point. Hysteresis in a Bourdon tube gauge is a mechanical property of the elastic element and its linkage; it cannot be corrected by adjustment. It indicates internal friction or material fatigue. For precision-class gauges, hysteresis should typically be below 0.1% of full scale; for common industrial gauges, tolerances might be 0.5% to 1.0%. Excessive hysteresis, even if individual points are in tolerance, suggests the gauge is nearing the end of its service life.
- Linearity Error: This is the maximum deviation from a straight-line relationship between applied pressure and the gauge's reading. If the error is -0.1 psi at 25%, -0.2 psi at 50%, and -0.1 psi at 75%, the response is non-linear. This often points to a problem with the uniformity of the Bourdon tube's elastic response or the geometry of the amplifying linkage.
- Repeatability Error: This is the variation between successive readings taken at the same pressure point under identical conditions. Poor repeatability, often seen as a "wandering" needle, is the most fundamental indicator of an unreliable gauge. It can be caused by a loose pointer, worn gear teeth, or contamination in the mechanism.
A technician might find a gauge that passes tolerance at every individual test point but shows 0.8% hysteresis on a gauge with a 0.25% accuracy class. The gauge technically "passed" at each point, but the hysteresis far exceeds the specification for its class. This should trigger an equipment inspection or rejection, not a simple pass sticker.
Setting Defensible Calibration Intervals Using Drift Analysis
Most calibration intervals are set by convention ("annually") or regulation, but neither approach is optimized for the actual performance of your instruments. The most defensible and cost-effective method is drift analysis : tracking the as-found data of your gauges across multiple calibration cycles to determine how quickly they drift toward their tolerance limits.
The goal is to achieve a target end-of-period reliability (EOPR) the percentage of instruments that are still within tolerance when they arrive for their next scheduled calibration. Many quality systems aim for an EOPR of 90-95%.
- If your EOPR is 98% or higher , your intervals may be unnecessarily short. You are spending money and taking equipment offline more often than needed.
- If your EOPR drops below 85% , your intervals are too long. You are operating with undetected OOT conditions, creating significant process risk.
Implementing this requires disciplined data collection. You need at least three to five cycles of clean as-found data per gauge (or per group of identical gauges in similar applications) for the drift analysis to be statistically meaningful. While possible with spreadsheets for a small number of instruments, this level of analysis typically requires a dedicated calibration management software system like Beamex CMX, Fluke MET/CAL, or ProCalV5. By analyzing this historical data, you can confidently extend intervals for stable gauges in controlled environments while shortening them for gauges in high-vibration or high-temperature applications, ultimately reducing costs while improving overall measurement reliability.
When Your Calibration Program Needs More Than Certificates
A complete pressure gauge calibration procedure requires more than just following steps. It demands an understanding of uncertainty budgets, the diagnostic interpretation of error types, and data-driven interval decisions. Most calibration providers can generate a certificate. Far fewer can help you interpret what that certificate means for your process risk, your audit exposure, and your overall measurement strategy.
CTPM functions as the technical extension of your quality and engineering teams. We provide ISO/IEC 17025-accredited calibration with fully documented as-found/as-left data and compliant uncertainty statements. But our work goes further. With nearly four decades of experience supporting precision-dependent organizations in manufacturing, aerospace, medical, and research, we provide the metrology consulting to help you use that data effectively. Whether you need to optimize calibration intervals, prepare for an audit, or solve a recurring measurement problem, our team offers both lab-based and on-site calibration and technical services across Ohio and the broader Midwest.
Talk to CTPM about your pressure calibration program
Conclusion
The mechanical steps of a pressure gauge calibration are well-established. It's the decisions surrounding that procedure, reference standard selection, uncertainty budgeting, and interval optimization that separate a compliant program from one that actively reduces measurement risk.
Every calibration event generates data. The fundamental question is whether your program uses that data to get smarter over time or simply files it away until the next audit. Facilities that treat calibration data as a continuous improvement input, not just a compliance artifact, are the ones that spend less on rework, pass audits with fewer findings, and can trust their process measurements with justified, documented confidence.
Frequently Asked Questions
What environmental conditions must be controlled during pressure gauge calibration?
Temperature should be maintained near 20°C (68°F), the international standard, as Bourdon tube elasticity and pressure media density both vary with temperature. Barometric pressure must also be measured and accounted for when calibrating low-range absolute gauges or using a deadweight tester.
What does an out-of-tolerance finding mean for measurements taken since the last calibration?
An out-of-tolerance (OOT) as-found result triggers a reverse traceability investigation. The facility must evaluate if the deviation could have affected product quality or process control since the last known-good calibration. The scope of this investigation depends on the magnitude of the error relative to the process tolerance.
What is the difference between percent of span and percent of reading accuracy?
Percent of span (or full scale) is a fixed error value across the entire range; a 1% error on a 100-psi gauge is ±1 psi everywhere. Percent of reading is relative to the displayed value, so the absolute error decreases at lower pressures. Percent of reading is a tighter specification but can be misleading near zero.
What ISO standard governs pressure gauge calibration?
ISO/IEC 17025:2017 governs the general competence requirements for calibration laboratories, including those performing pressure calibration. It specifies rules for traceability, uncertainty, and documentation. The gauges themselves are often specified by standards like ASME B40.100, which defines accuracy classes and performance criteria.
How many test points should be used during pressure gauge calibration?
A minimum of five equally spaced points across the gauge's range (0%, 25%, 50%, 75%, 100%) is the standard for a full calibration. Using fewer than five points creates a significant risk of missing non-linearity errors that occur between the tested points.